
Dashboard and Widgets
Overview
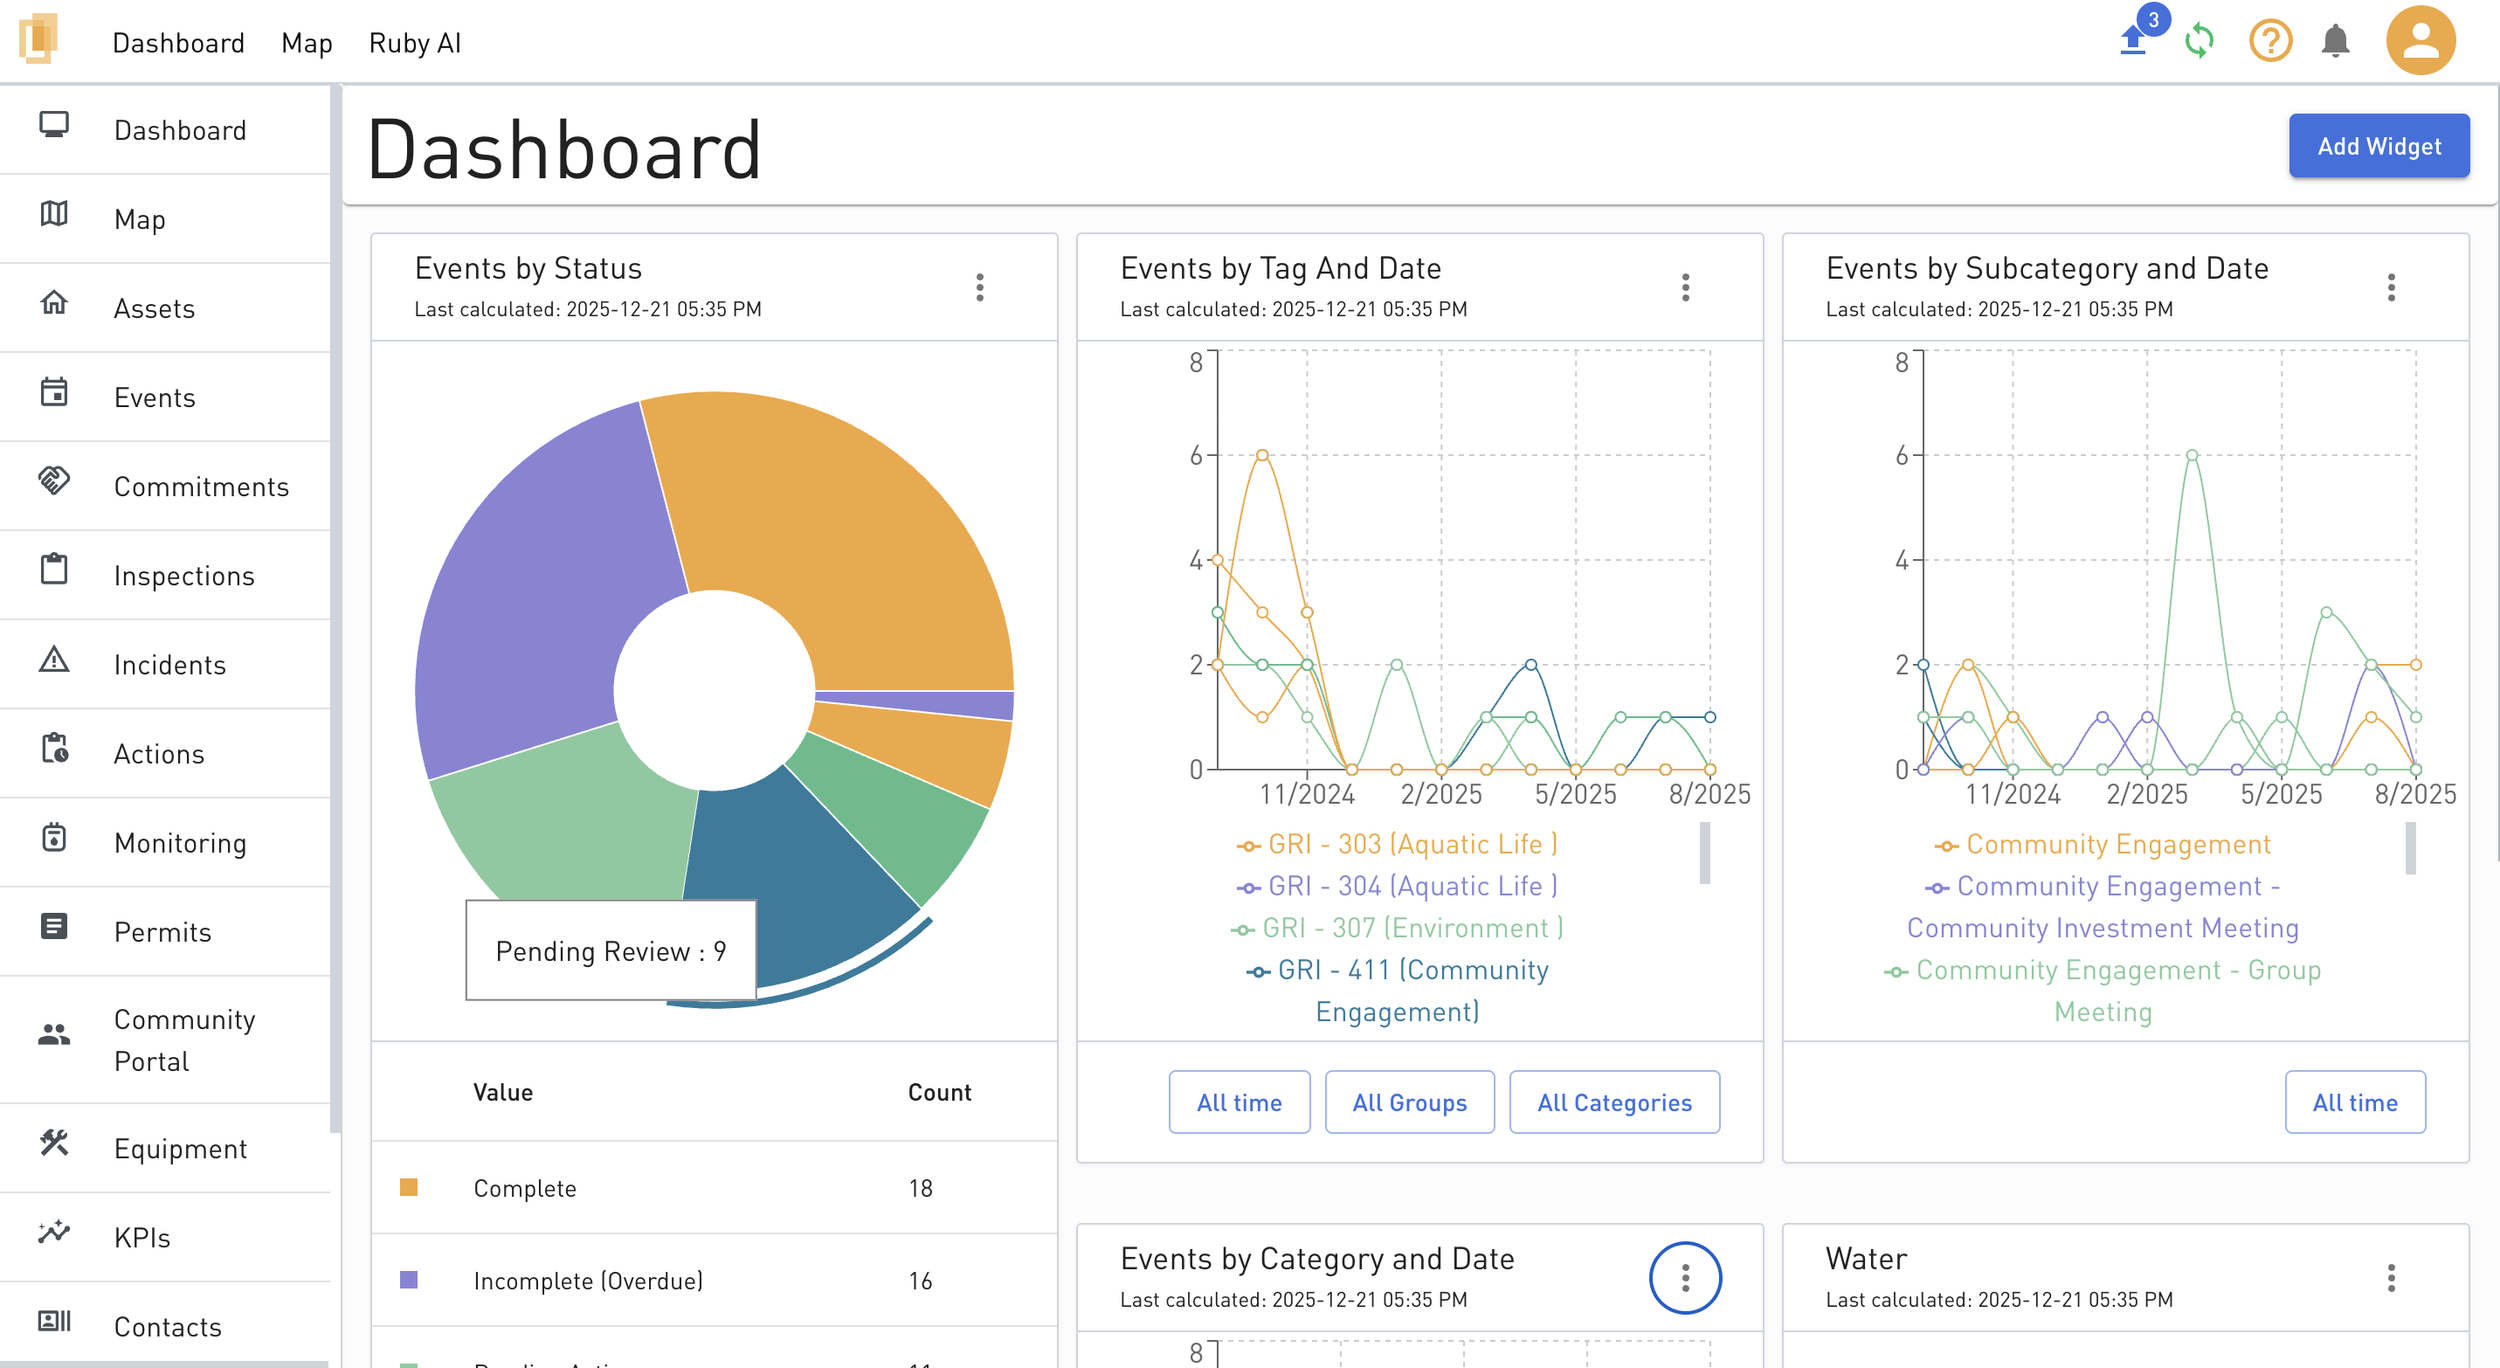
Navigating to the Dashboard allows users to see graph-based widgets showing the data captured in Lynx. Dashboards are useful for keeping track of activity at site.
Steps
To add a widget, click on Add Widget at the top right of the Dashboard page.
Create New Widget – Build a custom widget using your own selected filters and configuration.
Choose System Widget – Add a preconfigured widget based on standard system metrics.
Widget Type
Count List – Display a simple count of records matching selected filters.
Donut Chart – Visualize the proportion of records by category based on filters.
Bar Chart – Compare record counts across categories using filters.
Title – Define the name shown on the dashboard for the widget.
Select Filters – Choose one or more filters that determine which records are included.
All widget data and visuals are driven entirely by these filters.
Filter Results Preview – Review how many records match each selected filter before saving.
Create Widget – Save and add the widget to the dashboard using the selected filters and visualization type.
Widgets can be moved, exported as PNG and other options by clicking on the three dots on the top right corner of the widget box.